Blog
September 15, 2021

This blog post will explore the powerful Estate Reporting infrastructure visualization capabilities that are now available in CD for PE as well as some upcoming enhancements.
Table of Contents
Continuous Delivery for Puppet Enterprise
Today, it’s difficult to compile a list of all the managed infrastructure you have across your global estate. It’s even more difficult to collect all of the properties and values that make up that infrastructure, such as operating systems, enterprise licenses, networks, disks, mount points, data centers, regions, patch states, hypervisors, and so much more. Nevertheless, it’s ever more critical to have this information at your fingertips.
What if you could easily gain insight into all of the significant facts across your infrastructure and share this data across your organization using visualizations? With our latest release of Continuous Delivery for Puppet Enterprise, we’ve focused on making data more accessible for those with varying levels of technical expertise, while delivering rich and relevant insights to visualize infrastructure inventory.
Distributed systems
SysAdmins and Engineers who are regularly tasked with retrieving data from distributed systems understand the challenges and complexity that this entails. Previously in Puppet Enterprise this could only be done by making PQL queries to PuppetDB. Even worse, queries had to be directed at each PE server individually, requiring a considerable amount of time and expertise. However, not everyone is familiar with PQL and many are pressed for time to formulate these complex requests.
Why Estate Reporting?
With Continuous Delivery for Puppet Enterprise 4.7.0, you can now select and visualize the distribution of any fact, custom fact, or trusted fact value across all of your Puppet Enterprise servers. If your team often needs to collect data about your infrastructure such as:
- How many different versions of CentOS VMs do I have?
- How many of my compute resources are in GCP vs vSphere?
- How many physical servers are about to run out of warranty?
These and other questions can easily be answered in the user interface.
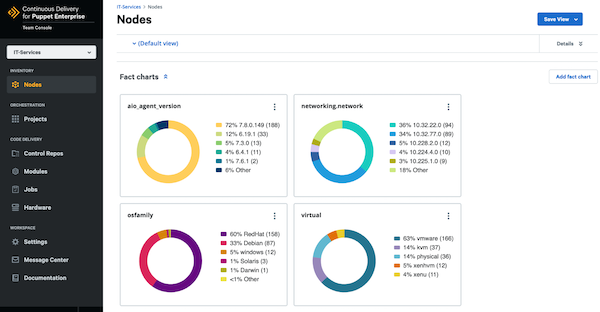
Continuous Delivery for Puppet Enterprise versions 4.7.0 and above come with four pre-built charts which allow you to have a consolidated high-level overview of your network. The fact charts can be modified and saved, allowing you to construct custom views of your infrastructure. These can also be shared with other teams and referenced in the future, which will save you time when answering frequent questions.
Robust queries made easy
Having the ability to filter and visualize your federated infrastructure in Estate Reporting is fundamental, and we know that you need to further refine this data. For this reason, we are developing a visual query builder in the interface. Compound filters will empower you to query your network and visualize the results without the need to write any PQL. The results will be supported in the fact charts mentioned above and once you have defined the queries that are most important to your team you can refer to these results time and time again.
Democratizing your infrastructure data
At Puppet we believe that infrastructure data should be directly available and delivered in an accessible format to all users. Estate Reporting makes that a reality and we hope that you find as much value in these features as we do.
Learn more
- Find out more about Fact charts in Version 4.7.0.
- Learn more about Building Custom Fact Charts.
- Find out more about Continuous Delivery for PE.
Nicole Joe is a Product Manager at Puppet.